Angular Profiler: A Powerful Developer Tool for Angular Development Workflow
Angular Profiler is a must-have developer tool for anyone working with Angular. Developed by Andrew Yang, this free Chrome extension is designed to power-up your Angular development workflow by providing a series of debugging tools.
With Angular Profiler, you can easily debug and visualize your Angular applications. The extension is specifically built for Angular's Ivy rendering engine, ensuring compatibility and optimal performance. Whether you're a beginner or an experienced Angular developer, this tool is invaluable for troubleshooting and optimizing your code.
One of the standout features of Angular Profiler is its comprehensive debugging tools. It allows you to inspect and analyze your components, directives, and services, providing detailed information about their state, properties, and performance. This level of visibility is crucial for identifying and fixing bugs in your Angular applications.
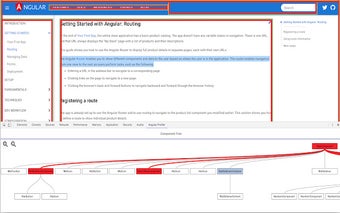
In addition to debugging, Angular Profiler also offers visualization tools. You can visualize the component tree, view the change detection graph, and analyze the performance of your application. These visualizations provide a clear and intuitive understanding of how your Angular application is structured and performing.
Overall, Angular Profiler is an essential tool for any Angular developer. It enhances your development workflow by providing powerful debugging and visualization capabilities. With its compatibility with Angular's Ivy rendering engine, you can be confident that it will seamlessly integrate into your Angular projects. Best of all, it's completely free to use, making it accessible to developers of all levels.